What is the Solution Readiness Dashboard and how it will help your IT Projects
In this blog, we will do a quick overview of what is the Solution Readiness Dashboard in SAP Focused Build and the features that it provides. The Solution Readiness Dashboard is part of SAP Focused Build and is an agile tool used by project managers to monitor project issues, milestones, and quality gates. The dashboard reports statuses based on available extracted live data and is extremely useful for all phases for a project.
Once you have the preset defined KPIs, you can always drill down into more detailed views and overviews are just a click away from the dashboard tiles. You see how many work packages are assigned to which wave of the build phase and what the distribution to the individual business process areas looks like. A click on the numbers brings you to the next-level drill down level.
Generally speaking, the dashboard shows rated tiles according to thresholds that are preconfigured. However, you can configure the thresholds according to your projects requirements. The tiles that are not rated are shown in neutral blue.
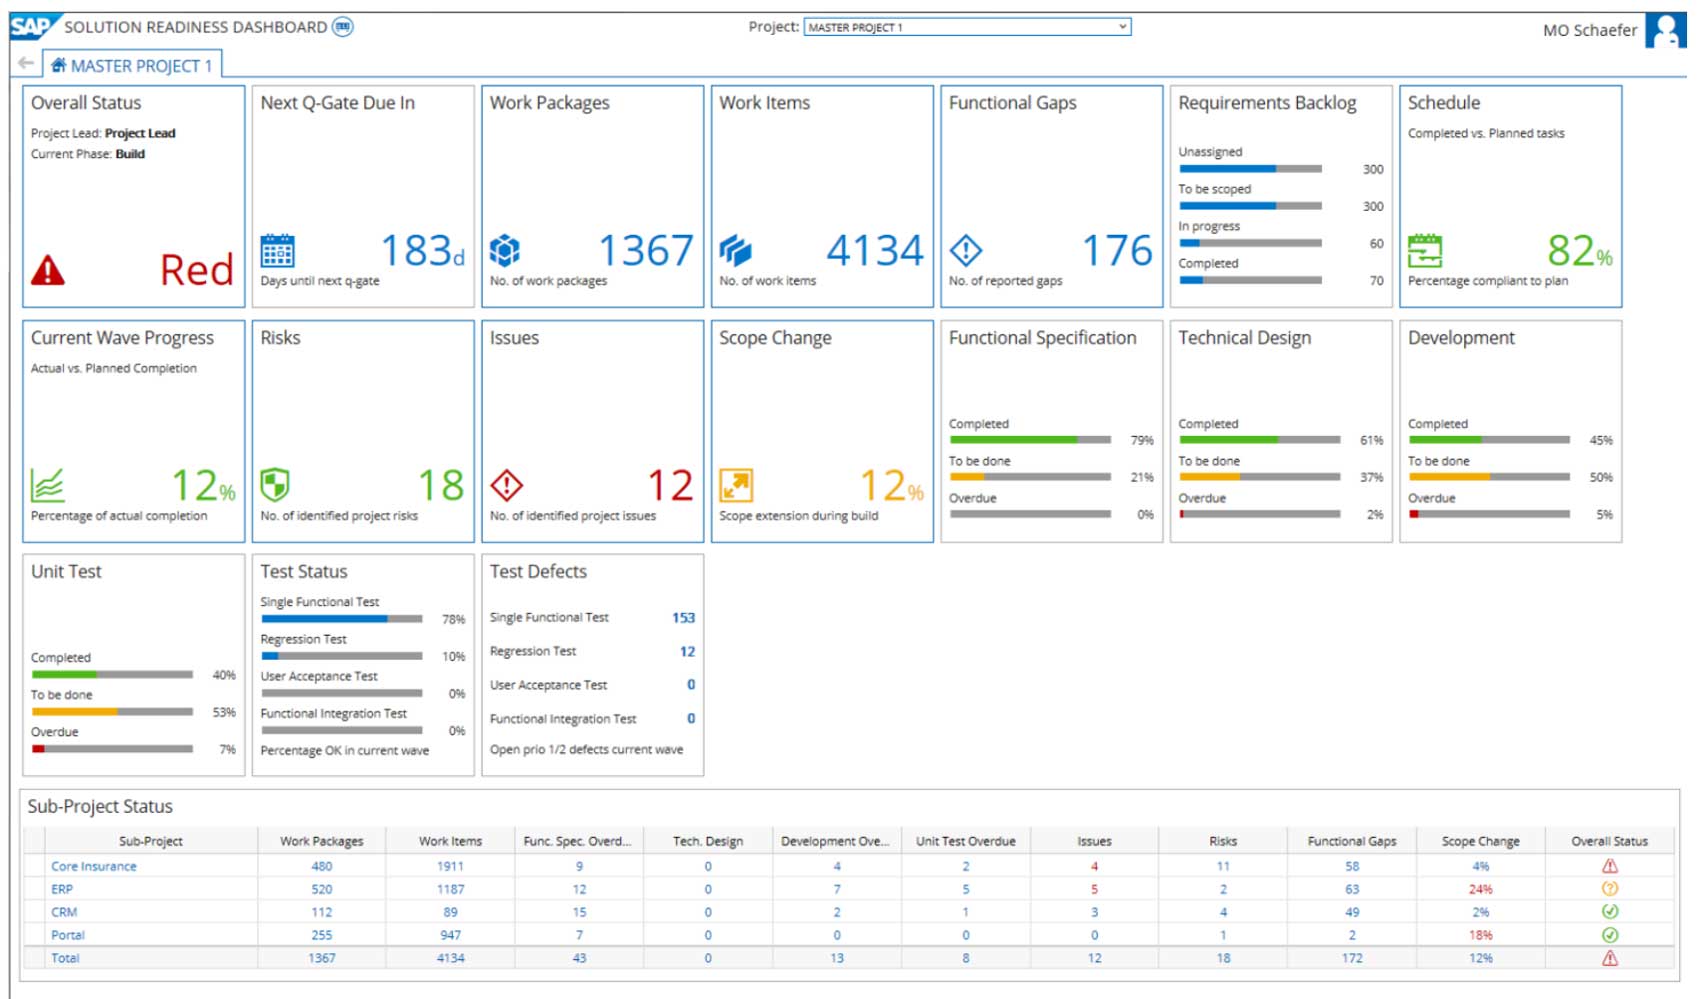
SAP Focused Build – Solution Readiness Dashboard
KPIs and metrics on the Solution Readiness Dashboard in detail
The following overview gives you detailed information on what the KPIs on the Solution Readiness Dashboard mean and how they are calculated as described by SAP.
Overall Status
The Overall Status is read from the project in SAP Solution Manager Project Management that you selected in the dashboard. The tile shows the name of the responsible project manager as well as the current phase of the project. The project manager sets the status manually in the project in SAP Solution Manager Project Management.
Next Q-Gate Due In
Number of days available until the next Q-Gate is due. The information is derived from the project plan in Project Management of SAP Solution Manager. The KPI is not rated and therefore is displayed in neutral blue.
Work Packages
Number of work packages assigned to the project displayed in the solution readiness dashboard. The KPI is not rated and therefore is displayed in neutral blue.
Work Items
Number of work items assigned to the project displayed in the solution readiness dashboard. The KPI is not rated and therefore is displayed in neutral blue.
Functional Gaps
Number of functional gaps assigned to the project displayed in the solution readiness dashboard. The KPI is not rated and therefore is displayed in neutral blue.
Requirement Backlog
Number of requirements assigned to the selected project.
Schedule
Ratio of completed Project Management tasks in the project plan versus the planned ones.
Risks
Number of risks assigned to the selected project. The rating is done according to status, impact and probability. The KPI turns red if one or more of the risks assigned to the project have been triggered. It also turns red when there are risks with high impact and high probability that do not contain a mitigation plan.
Issues
Number of issues assigned to the selected SAP Solution Manager Project Management project. The rating is done according to the issues’ priority. The KPI will show a red rating when there are one or more issues with priority very high that are not in status “Confirmed”.
Scope Change
Calculates the percentage of changed work packages vs. all work packages in the selected project. The KPI takes into account all work packages in status Handed-over to development that have scope changes assigned to them.
Functional Specification
Percentage of functional specifications according to status and due date. The KPI takes into account whether a functional specification with the correct document type and expected status has actually been assigned to a work package.
Technical Design
Percentage of technical designs according to status and due date. The KPI checks whether a technical design with the correct document type and expected status has been assigned to a work item.
Development
Percentage of work items according to status and due date.
Completed: Work items are in status Hand-over to test and the milestone Build finished is not yet reached.
To be done: Work items are not in status Hand-over to test but the milestone Build finished is not yet reached.
Overdue: Work items are not in status Hand-over to test and the milestone Build finished has already passed.
Unit Test
Percentage of work items according to status and due date.
Completed: Work items are in status Unit test successful and the milestone Unit test finished is not yet reached.
To be done: Work items are not in status Unit test successful but the milestone Unit test finished is not yet reached.
Overdue: Work items are not in status Unit test successful and the milestone Unit test finished has already passed.
Test Status
The Test Status is extracted from the test management dashboard. It takes into account all test types for the selected project for the current wave. The tile shows the percentage of successful tests for:
- Single functional test
- Functional integration test
- User acceptance test
- Regression test
Defect Details
Data for this tile is extracted from the test management dashboard. It takes into account all test types for the selected project for the current wave. The tile shows how many priority 1 or 2 defects are open for the current wave for
- Single functional test
- Functional integration test
- User acceptance test
- Regression test
Drilling down from master project to sub-project
On the sub-project level, you find the Process Area Status that shows the status per process area of the project and indicates which documents or activities are behind schedule (overdue), and thus lets you know what items you have to look at most urgently as a project manager.
The only exception to the automated reporting of the other tiles in the dashboard is the Overall Status tile. It shows the project status set manually by the project manager in SAP Solution Manager. The benefit of this is that the project manager can override automatic reporting that he or she thinks is misleading, and raise a “stop sign” to indicate that there is a problem. This is especially important in instances when issues occur in areas of project management that are explicitly and consciously not tracked by the Focused Build methodology like organizational change management, or cost management.
We hope this article gives you a better insight into how you can utilize the Solution Readiness Dashboard to help manage your projects. if you like to discuss more about how you can use SAP Focused Build to help your team, reach out to us!


CI/CD Pipelines for SAP Transport Management with Azure DevOps
SAP teams are under pressure to deliver changes faster, but SAP transport management often remains…

Did You Know? Sustainable SAP Delivery with Jira and Cloud ALM
A successful SAP go-live is important, but the bigger question is what happens after the…