Reduce downtime & monitor your SAP Applications anywhere with SAP Technical Monitoring
In this blog, we will discuss what SAP has planned for technical monitoring and how you can leverage it to reduce downtime and monitor your applications.
SAP has changed the User-Interface (UI) completely. As you are probably aware with the older releases, a lot of the 7.1 customers/users were not very pleased with many things in Solution Manager, like: how to navigate to applications, how to launch technical dependencies, issues with different browsers, using different flash technologies, etc. SAP realized this through customer feedback and for 7.2 they completely revamped the UI.
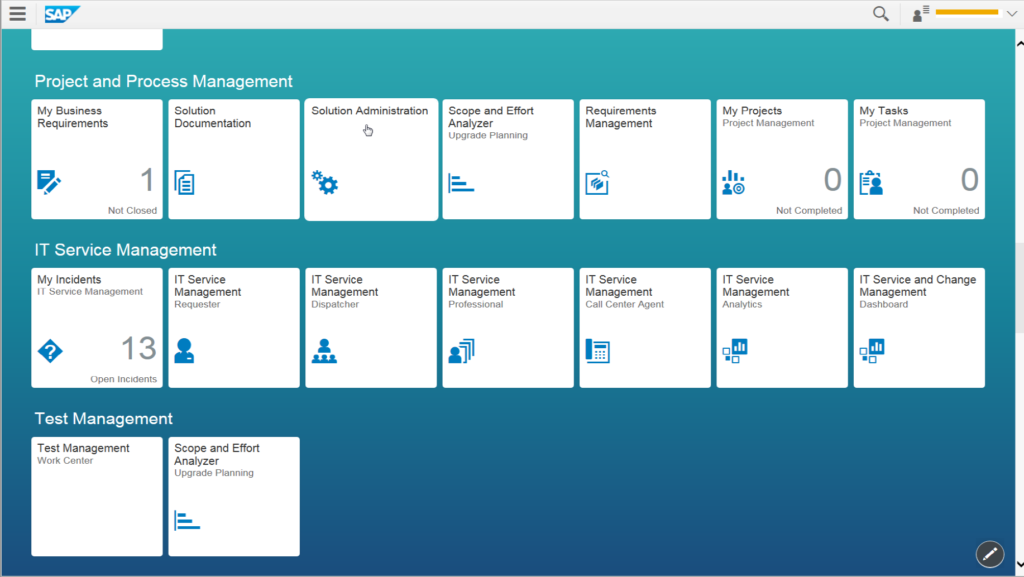
SAP introduced the Fiori launchpad; if you have other applications in your environment (like S/4HANA) then you are probably familiar with the Fiori launchpad concept. You can easily integrate and make Solution Manager functionality available in your master Fiori system, or Solution Manager comes with its own gateway and capability to handle the Fiori launchpad.
New Fiori Launch Pad
All functionalities have migrated to Fiori and SAP UI5. Thus, eliminating the need for different flash technologies and different browser dependency versions, which have mostly been removed. Most customers have been pleased with this decision from SAP as it has been received as a “step-forward” in terms of development. The other piece is the Embedded Search with Fiori, enabling you to quickly search for content and keywords across all areas of Solution Manager. If you are using Change Management,Test Management, or Technical Monitoring, then keywords will return your desired results. In non-HANA database, you will require the TREX search engine to help you with the searching.
However, with HANA the Embedded Search is included. It can also search the content you may have in documentation. Altogether, this tool generally covers all of Solution Manager. SAP’s goal was to improve User Experience continuously with a Fiori launchpad. Besides some very technical steps that require you to use SAP GUI, 95%+ of the functionality is available through the Solution Manager web browser. Now it’s easier for end-users to consume and deploy the functionalities and tools within Solution Manager.
There are many Technical Monitoring tools that can provide a technical monitoring perspective. You have the OS tools, database tools, perhaps SAP tools, but when considered from a realistic perspective, SolutionManager does provide customers with the complete tools to monitor all the layers: the Database, Operating System, and Solution Manager. The idea is to not only monitor Reactively (like when the system goes down or URL is not available), but even better to monitor Proactively (which is anticipates a system failure) and prevent issues from occurring. Therefore, reducing major outages for your systems.
When we take a look from a Scope Perspective, the scope of application operations really includes several different areas. You have System and Application Monitoring, from traditional OS-DB monitoring, with multiple areas inside each application that SAP Solution Manager can monitor. Also, there are different ways to look at it: 1)Traditional 2)User experience monitoring 3)Integration monitoring (monitor PI or PO instances and see how communication is working 4)Job monitoring (other job management tools with more monitoring of those jobs by setting dependencies and more parameters for alerts) and 5)HANA Business Intelligence monitoring from a Business Objects perspective.
Another area is Root Cause Analysis: as Solution Manager is cranking,working,and collecting data of all managed systems, it will build those trends. So, when you look at the data, you can go into each application and look at Performance Data and Historical Data. In Solution Manager, the data is stored in the Business Warehouse portion and is kept for longer durations: trends for month-to-end issues or even quarter-end, and closing of books that are causing issues.
Also, it has been realized that SAP would like to leverage Solution Manager data to help with performance issues on certain applications. So, it is very useful for SAP as well. Once the data has been collected, we have the technical analytics and a dashboard to view it in. With this new design, each area is monitored, this way it’s all embedded in the same user-interface. Lastly, the Technical Administration Guided Procedure is where you can use Guided Procedures for different things that happen in your environment. For instance, say you have a procedure in place, now you can document it in Solution Manager and allow support teams to go in and perform a series of checks.
I hope this blog gives you an insight on how you can leverage technical monitoring with SAP Solution Manager for your applications. If you have any further questions on technical Monitoring in your project, feel free to reach out to us today!
Did You Know? CAB-Based Governance Doesn’t Scale for Modern SAP
Modern SAP landscapes extend beyond core systems into BTP, integrations, and cloud services. Yet governance…
Did You Know? Traditional SAP Governance Slows Delivery Without Reducing Risk
Most SAP governance models rely on CAB meetings, complex approval chains, and manual evidence collection.…



You must be logged in to post a comment.